SVG map
While various map formats are supported, SVG is usually the optimal choice for the following reasons:
- No quality loss upon zooming: unlike raster images, SVG vectors maintain sharpness even when zoomed in.
- Interactivity: Mapplic can identify specific SVG elements, making them clickable and applying various styles for their base, hover, and active states.
Mapplic compatibility
Any vector editor with built-in layer management can be used to prepare a map, for example, Adobe Illustrator, Figma or Inkscape.
Transform any SVG file into a Mapplic compatible SVG by ensuring that the following criteria are met.
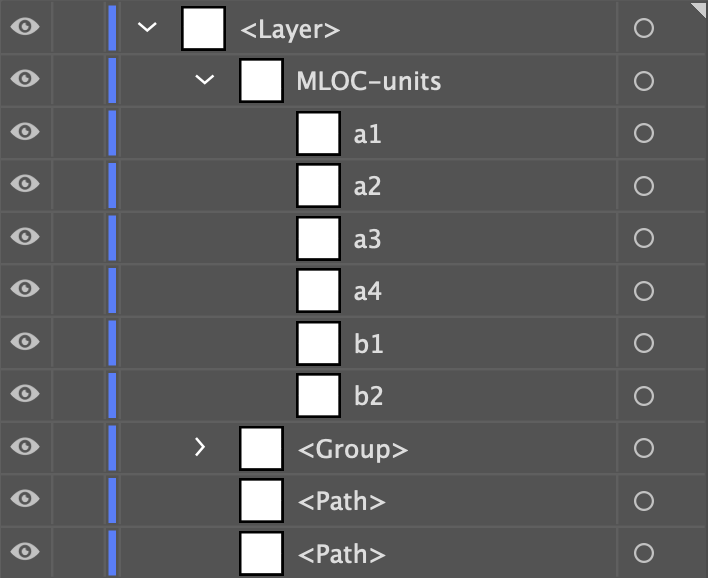
MLOC- group
Select all elements that should be interactive and Group them (Ctrl/Cmd + G in most editors), then name the group starting with MLOC- (case sensitive).
The prefix is essential for the software to recognize elements as interactive.
Examples: MLOC-lots MLOC-units MLOC-first-floor
Name elements
Each child within the MLOC- group must have a unique name that starts with a letter.
Examples: s100 s120 location15 lot24 a3
The SVG element will be linked to the Mapplic location through the ID property.
Example: correct SVG element structure.
Once you’ve verified that the above criteria are fulfilled, your SVG file is ready for uploading.
Clicking any of the interactive elements within the builder should bring up the Add location popup and the recognizer can also be used.
Optimization
Given that Mapplic is a web application, it’s vital to ensure that the map file(s) remain lightweight and well-optimized. Uploading large files can have adverse effects on performance and loading times.
Achieving optimal SVG exports can be challenging, requiring a thorough understanding of the file format. Below, you’ll find a set of practices that can help you achieve the best results:
- Occasionally, elements are hidden or become invisible due to overlapping graphics. Ensure that you remove any redundant elements.
- Discard details that are imperceptible even when fully zoomed in.
- Sometimes, anchor points are excessively used, leading to unnecessary points in the graphic. You can manually remove them or use a shape simplify tool.
- When saving the file, be sure to include at least 1-2 decimal points, but don’t overuse them to prevent file size increase.